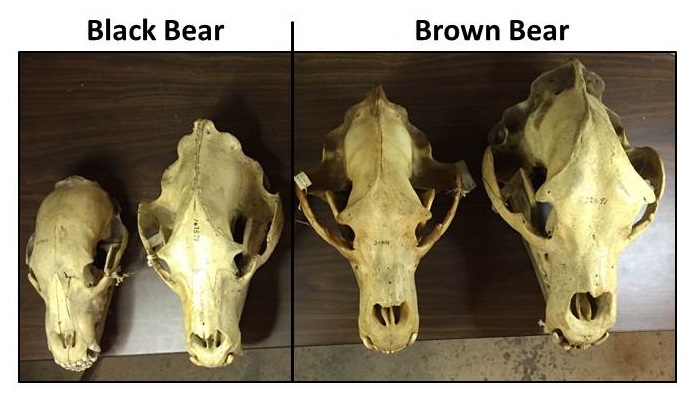
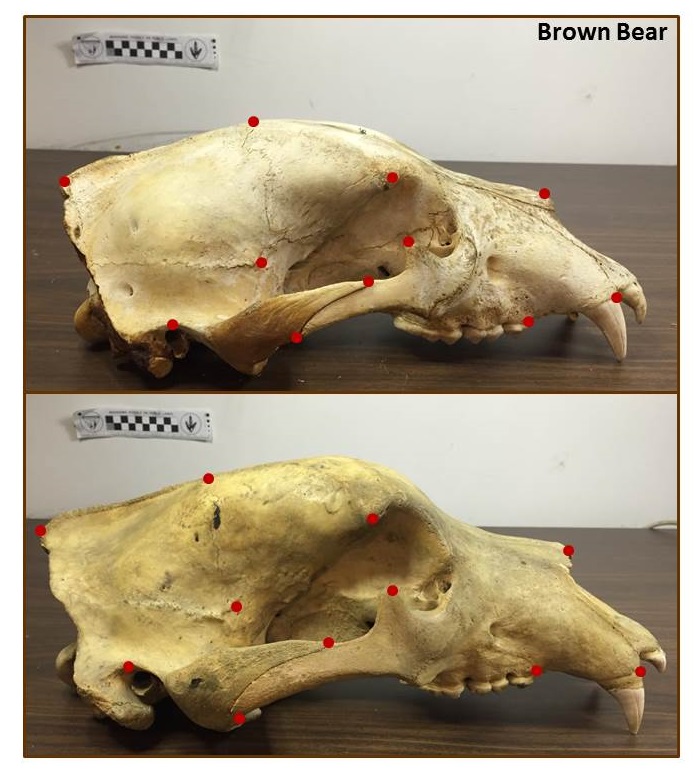
First up, this post is about using landmarks (on bones) to answer evolutionary questions, not my list of significant papers in evolution*. Landmarks are points on a specimen (e.g. bones, leafs, etc) that can be identified based on a specific rule (example- widest part of the cheek bone). I’ve highlighted a few landmarks on two bear skulls in the picture below. Sutures, where different bone plates come together, are high quality landmarks. But all landmarks cannot be at sutures, thus other types of points include “tips” (e.g. nose, orbital/eye socket, back of the brain case, or position of teeth). Historically, researchers would calculate the distance between landmarks then analyze that data; however, newer techniques measure the 3D coordinate (X-Y-Z) in space for each landmark using a microscribe or 3D scanner. Once the 3D data is collected, the points can be linked in the computer to build wire frame models for each individual. Finally, we can start comparing how 3D shapes change between groups (males vs females; species 1 vs species 2).
Landmark studies have made significant contributions towards understanding evolution, particularly the link between form (aka- shape) and function. Paleobiologists first measure the shape of a feature such as a jaw, pelvis, finger bone, or eye socket across multiple closely related species that have functional variation between the trait. By understanding how the structure informs the function of different species in the present, they can then measure fossils and come up with hypotheses for how extinct animals may have functioned. Anthropologists can use this data to build trait based (instead of DNA sequence based) phylogenies to understand how species are related to each other.
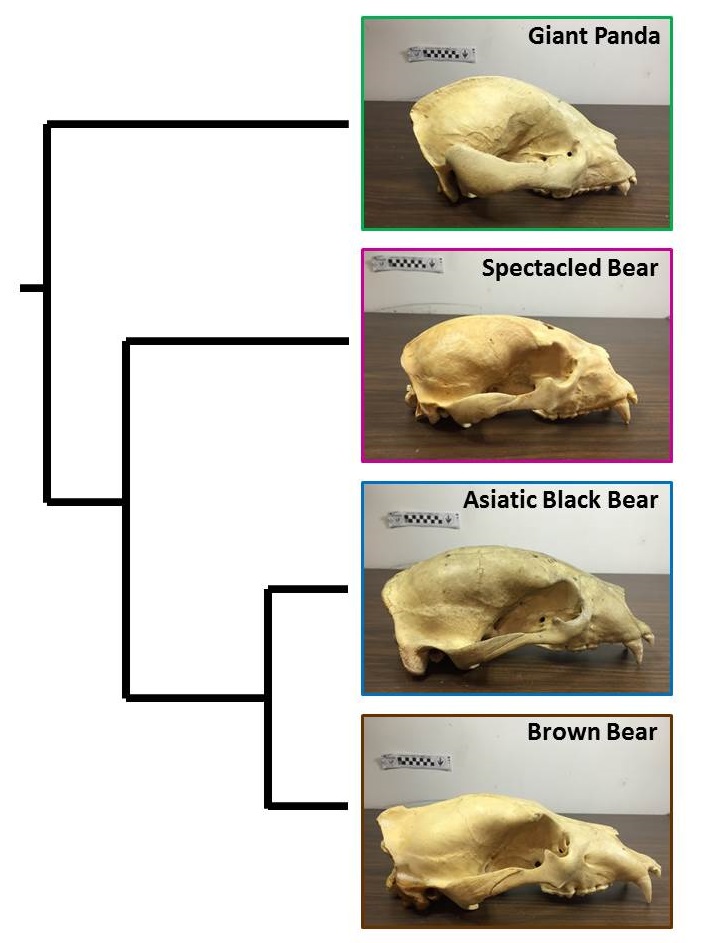
I’ll use the bear family as an example of how morphological function allows for inference into ecology and evolution. You can see in the figure below that there is a lot of variation in bear skull traits including: how domed the skull is, thickness of the bones in the zygomatic arch (aka- cheek bone), the shape of the eye socket, distance of eye from the nose, and slope of the snout to name a few. Some variation in skull shape is associated with feeding ecology which is a fancy way to describe what and how an animal eats (e.g. do they rip their food, crack bones, scavenge, stalk, etc). Bears run the spectrum of diets as giant pandas are herbivores with a specialized bamboo diet, sloth bears are insectivores eating lots of termites, polar bears are carnivorous specializing on the blubber of seals and small whales, and the rest of the bears are omnivores with fairly high proportions of their diet coming from plants.
Scientists used skull landmarks to infer the feeding ecology of the extinct giant short-faced bear (Arctodus simus). The short-faced bear lived in North America and went extinct ~10,000 years ago (see Twilight Beasts for more info on this species). Being such a large animal, there is a hypothesis that the short-faced bear was a ferocious carnivore that chased down ungulate prey and exerted high bite force with strong jaws. However, when the skull data was analyzed the shape of short-faced bears was more similar to the omnivorous bears versus the carnivorous bears, suggesting that the diet was similar to brown and American black bears with lots of vegetation. The scientists also measured limbs and observed that for the short-faced bear’s body size the limbs were not so long, thus it probably didn’t chase its prey.
Feeding ecology is not the only question that can be answered using geometric morphometrics. I think the studies of primate locomotion are particularly interesting. Using evidence ranging from the extent of grasping in hands and feet, movement in the shoulder joint, and position of the pelvis can clue us in to whether an extinct primate swung through the trees, walked on land, or did a combination of both. There are lots of fun questions that geometric morphometrics can answer, including delimiting species which is of both evolutionary and conservation importance.
* SorryNotSorry for the clickbait. But if you did come for classic papers check out these lists: here, here, here, and on Twitter #evobioclassics.